The ERP implementation failure rate nobody can source
The ERP implementation failure rate is quoted as 68%. The report behind it sits behind a form, and the careful sources refuse to give a single number at all.
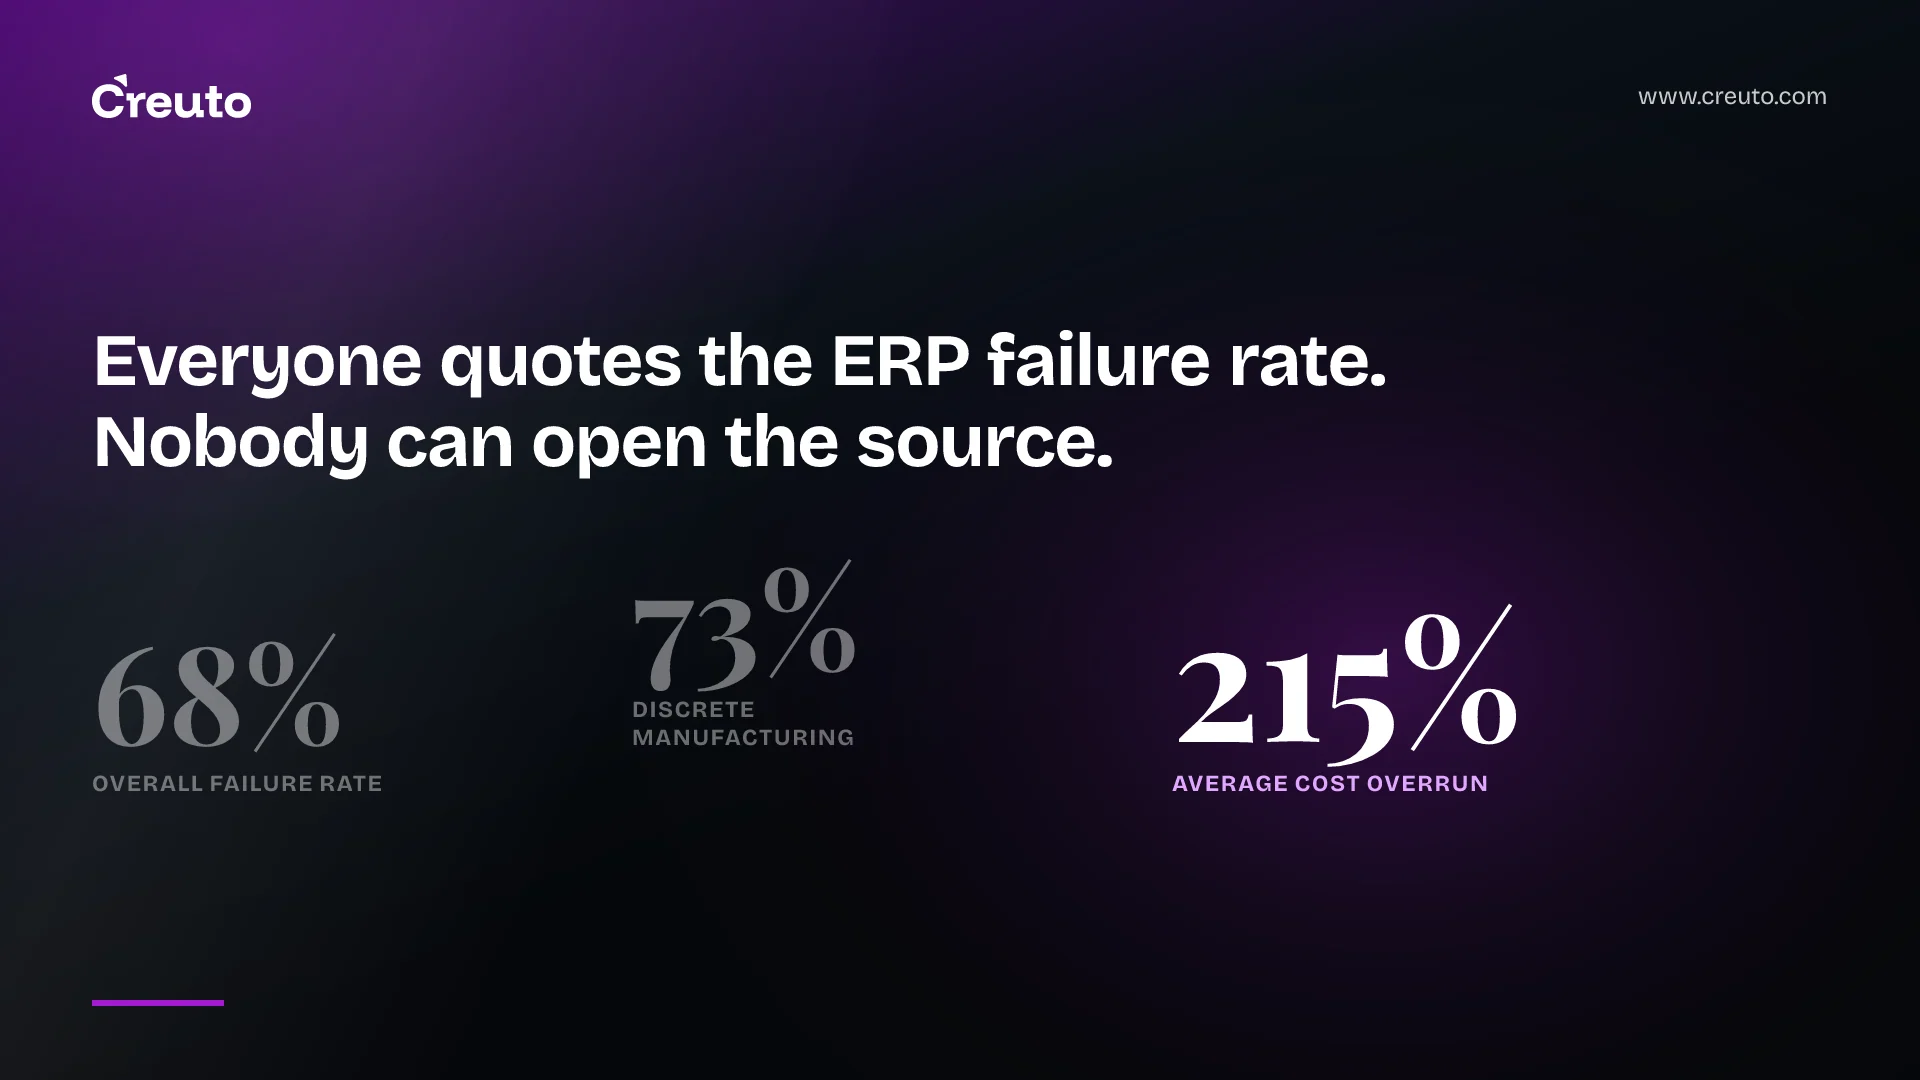
Somebody has quoted you an ERP implementation failure rate. It was probably 68%, possibly 75%, and it arrived in a slide from a consultancy explaining why you need their methodology.
We went looking for where that number comes from. The chain runs out faster than you would expect, and what we found at the end of it is more useful than the statistic itself.
Following the number backwards
The figures in circulation are consistent enough to look authoritative. A widely cited summary attributes all of the following to the Panorama Consulting Group 2026 ERP Report:
- 68% overall failure rate
- 73% failure rate for discrete manufacturing
- 189% average budget overrun industry-wide, 215% for discrete manufacturing
- 25% average timeline extension, 30% for discrete manufacturing
- 27% objective achievement rate in discrete manufacturing
That page states the research draws on more than 2,400 ERP implementations, over a research period of September 2025 to January 2026.
Now compare that with a second analysis drawing on the same firm. It declines to give a single rate at all. It offers 50-75% of projects exceeding budget, timeline or benefits, attributes that to Panorama and Gartner findings across multiple years rather than to one report, and puts outright abandonment in the low single digits to low teens percent.
It also says the quiet part out loud: the honest answer depends entirely on the definition.
The two are not really in conflict about the world. They are in conflict about how confident anyone is entitled to sound. One gives you 68% to two significant figures. The other gives you a range twenty-five points wide and explains why a single number would be misleading. The precise one is the one that ends up in slide decks, because a range does not fit on a slide.
The obvious move is to read the report. Panorama's archive lists the reports by year with download links; the reports themselves sit behind a form. So the primary source for the most-quoted number in enterprise software procurement is a lead-generation asset, and the versions of it circulating in sales decks have already diverged from each other.
Why the number cannot mean what it is used to mean
Set the sourcing aside for a moment, because there is a deeper problem. "Failure" is not one measurement.
A project can exceed its budget and deliver every objective. It can land on budget and deliver nothing anyone uses. It can run 30% over schedule and still be the best decision the company made that year. These are four different outcomes and the published statistics fold them into one word.
Look at the numbers above again with that in mind. A 27% objective achievement rate and a 73% failure rate are the same measurement stated twice — they are complements, not corroboration. Quoting both makes the evidence look twice as deep as it is.
Meanwhile the outcome executives actually fear, total abandonment, sits in the low single digits to low teens percent. The distance between "68% of these fail" and "roughly one in ten is abandoned" is the whole difference between a reason not to start and a reason to plan carefully, and it vanishes inside a headline percentage.
What the number is used for
It is worth being precise about the incentive here. Nobody in this chain is lying. A summary page compresses a report, a slide compresses the summary, and each step drops a qualifier that felt like detail at the time. By the fourth hop the range has become a point estimate and the definition has vanished entirely.
Almost always, to sell something. A high failure rate justifies a change-management practice, a longer discovery phase, a bigger systems integrator, or a switch to whichever platform the presenter represents. We are a software company that builds custom ERP; the same number could be used to sell you our work just as easily.
That is the tell. A statistic which supports every possible recommendation is not evidence for any of them.
The questions that replace the statistic
If you are deciding on an ERP programme, the failure rate is not an input you can use. These are.
Which failure mode would actually hurt you? A 40% budget overrun on a two-crore project is survivable. A platform nobody adopts is not, at any price. Rank the modes before you plan against them, because the mitigations are different and mostly incompatible — fixed-scope contracts control overrun and guarantee an adoption problem.
How many processes are genuinely yours? The strongest predictor we see is not project size, it is the ratio of processes that are genuinely distinctive to those that are standard because everyone does them that way. If most of the operation is standard, off-the-shelf configured lightly will beat anything custom. If the distinctive processes are the business, forcing them into someone else's data model is where the money actually goes.
Who owns the data model? ERP projects rarely fail at the software layer. They fail because four departments each had a definition of "customer" and the project needed one, and nobody had authority to choose. That decision has an owner or it has a committee, and committees produce a schema that satisfies everyone and describes nothing.
What happens in month fourteen? Most published failure statistics measure the implementation. Nobody measures the year after, which is when the system either becomes the source of truth or becomes the thing people export to a spreadsheet. Budget for that year in the original business case.
Three questions for whoever quoted you the number
You do not need to win an argument about methodology. You need to know how much weight the number can carry, and three questions settle that in about a minute.
“Which report, and can you send it?” If the answer is a link to a summary of a report rather than the report, the chain has already been through at least one paraphrase. That is where the sample size and the definition get lost.
“How did that study define failure?” If the answer is anything other than a specific measurement — exceeded original budget, missed go-live by more than x, benefits not realised at month twelve — then the number is an aggregate of things you would treat very differently.
“What is the abandonment rate in the same study?” This is the useful one. It is almost always far lower than the headline, and asking for it usually reveals whether the person quoting the statistic has read the source or inherited it from a deck.
None of this is hostile. A vendor who can answer all three is worth listening to on everything else, which is precisely why it is worth asking.
What we saw building one
We built a custom ERP for a large-scale industrial client, unifying HR, CRM, inventory and finance into one browser-based platform with no data silos after launch.
The hard part was not any of the four modules. It was that unifying them required deciding, once, what an employee record was — and HR, finance and operations had each been maintaining their own version for years, all three internally consistent and mutually contradictory. No amount of software addresses that. Somebody with authority has to say which one wins, and accept that two departments will have to change how they work.
Every ERP project we have seen struggle, struggled there. None of them struggled because the framework was wrong.
That failure mode does not appear in any statistic we could find, because it is not a property of the project. It is a property of the organisation the project landed in, and it is visible before a line of code is written — which makes it far more useful than a percentage, and far less comfortable to put in a proposal.
Use the statistic honestly or not at all
There is a defensible version of the claim: a large share of ERP projects miss their original budget, timeline or benefit targets, the proportion is somewhere between a half and three-quarters depending on which of those you measure, and outright abandonment is uncommon. That is vaguer than 68% and it has the advantage of being supportable.
If a vendor quotes you a precise failure rate, ask which report, which year, what sample, and how failure was defined. The answer tells you more about the vendor than the number ever told you about ERP.
And if you are weighing custom against off-the-shelf, the honest input is your own process inventory, not an industry percentage. We are happy to go through that inventory with you, including in the cases where it says do not build.
Frequently asked questions
The most quoted figure is 68%, attributed to Panorama Consulting Group's 2026 ERP Report. The report is behind a download form, and two summaries of it describe different sample sizes and research periods.
Because failure is defined differently in each study. Budget overrun, schedule slip, benefit shortfall and abandonment are separate outcomes, and headline percentages fold them into one word without saying which was measured.
Rarely. Total abandonment is consistently reported as uncommon, which is a very different picture from a 68% failure rate. Most projects that count as failures still deliver a working system, late or over budget.
In our experience, the ratio of genuinely distinctive processes to standard ones, and whether a single person has authority to settle conflicting data definitions between departments. Neither appears in published failure statistics.
Inventory your processes first. If most are standard, configure an off-the-shelf platform. If the distinctive processes are the business itself, forcing them into someone else's data model is where budget overruns come from.