Search latency optimization: Uber Eats changed the metric
Search latency optimization at Uber Eats: the metric swap that halved end-to-end latency, which techniques generalize, and what request hedging really costs.
Uber Eats cut end-to-end search latency in half, and the most reusable part of the work was not an optimization at all. Before anything else, the team replaced backend API response time with Above-the-Fold completion as its primary measure. That single swap is what made every later search latency optimization worth doing, because it changed which milliseconds counted.
Everything after the metric is a catalogue of what a company at Uber's scale can afford. Product-level embeddings, a column-oriented ad-serving rewrite and GPU model serving are not on your roadmap and probably should not be. The measurement decision is free, and it is the one we would take to a client on Monday.
Why the metric change is the only part of Uber's search latency optimization most teams can copy
Uber's engineering post, Halving the Time: How Uber Eats Rebuilt Its Search Pipeline, published 10 September 2026, defines the new metric precisely: ATF (Above-the-Fold) completion is "the time from query submission to when the first screen of results is fully rendered with images in the viewport."
The justification is one sentence, and it is the whole argument of this post: "API latency can improve while someone sees no difference if the bottleneck is in payload transfer, template rendering, or image loading." A backend chart can trend down for a quarter while the product gets no faster.
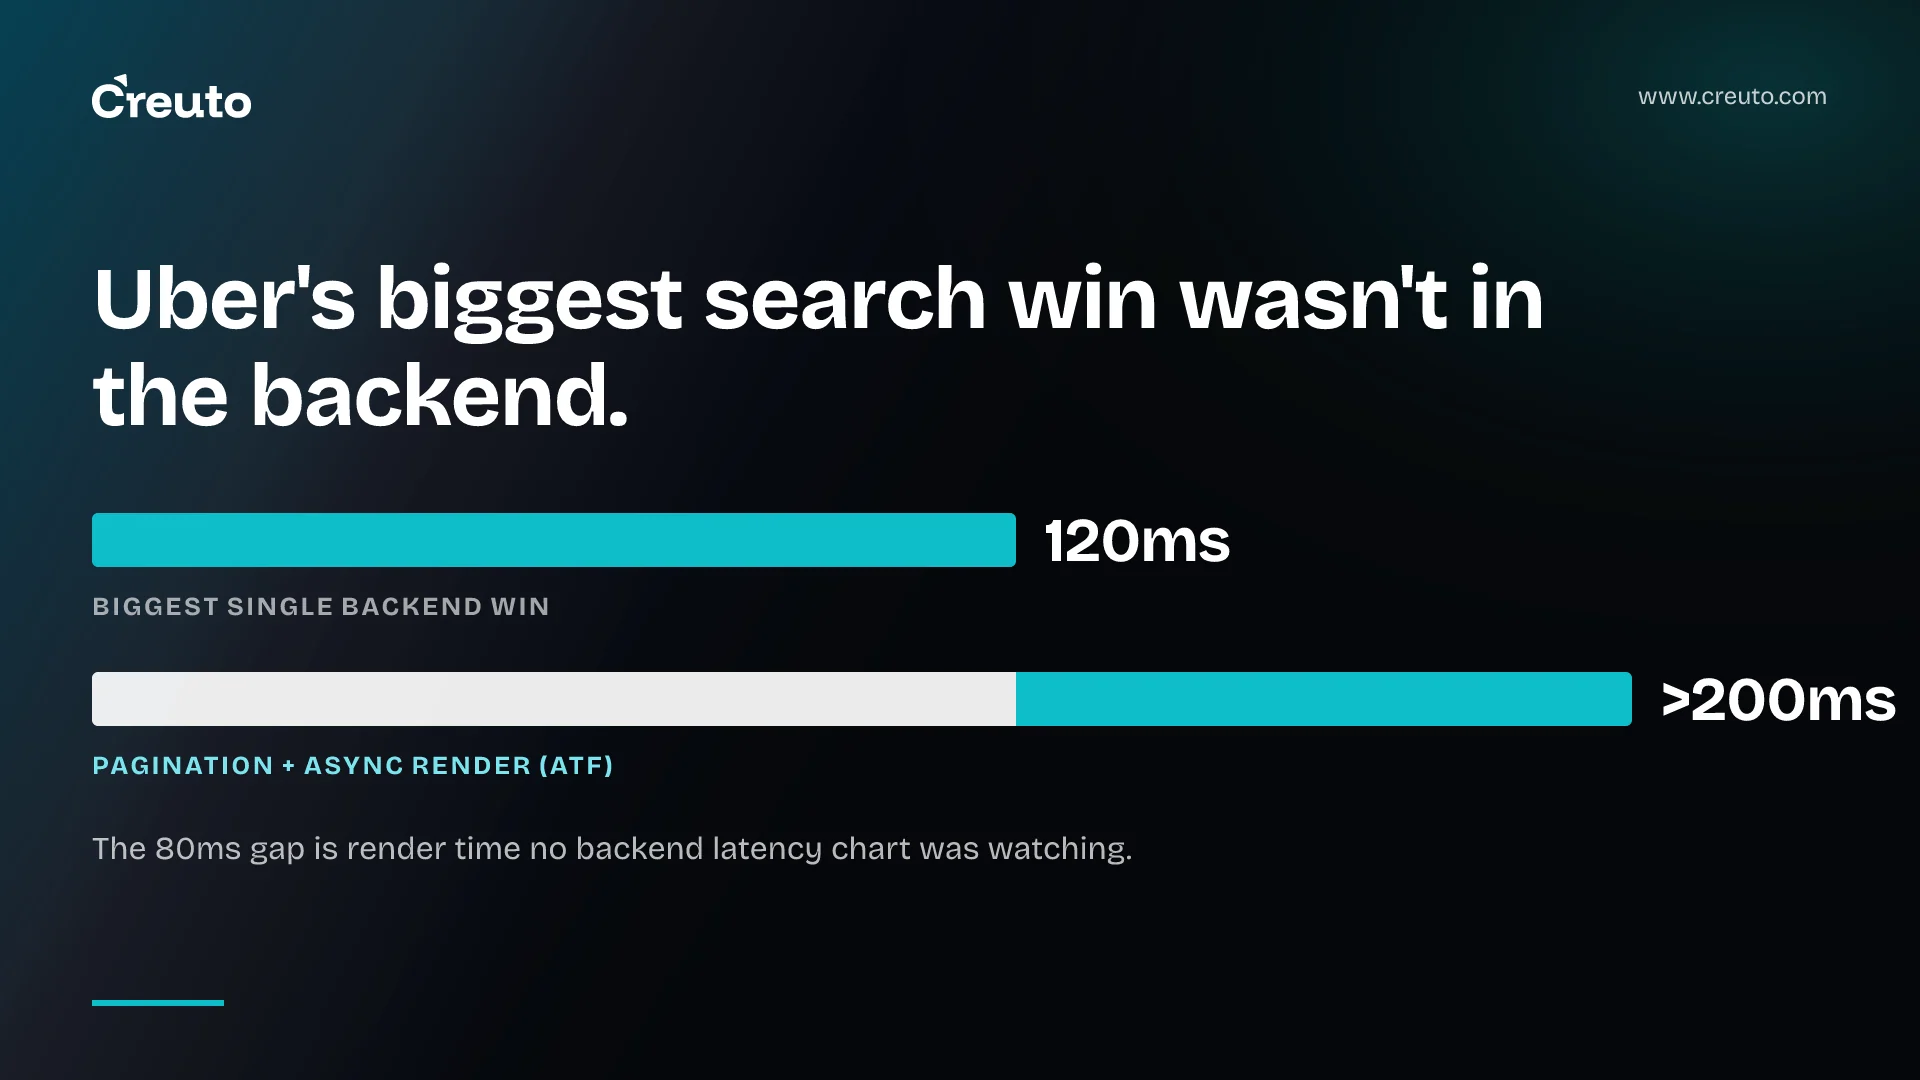
The proof is in which change paid best. Uber's single largest backend saving was roughly 120 milliseconds from deleting broad-recall lexical retrieval strategies that were adding latency while contributing little incremental value. The presentation layer beat it: pagination with a server-side cache, plus moving HTML template rendering from sequential to concurrent, delivered "an over 200 millisecond improvement in ATF latency." Under the old metric, that work would not have registered as a latency project at all.
This is the same failure mode we wrote about in measuring where a pull request actually waits. A proxy metric improves, the team celebrates, and the experience the customer has is governed by a stage nobody instrumented. If you only read one thing from Uber's post, read the pull request cycle time lesson into it: measure the span the human endures, not the span your service owns.
Where the secondary coverage and Uber's own post disagree
InfoQ's write-up, published in October 2026, is accurate on the headline and compresses the ledger in ways that change what a reader would take away. We checked every component figure against Uber's own post. Three do not survive the trip intact.
| Figure | How the secondary summary reads | What Uber's post actually says |
|---|---|---|
| 35 ms | "dependency removal" | Parallelizing item ranking and hydration. Removing the live item-signal dependency from the store ranking model is a separate item, and it is only targeting a further 20 ms. |
| ~130 ms | The column-oriented advertising redesign | The combined end-to-end figure for all ads work. The column layout plus moving campaign and pacing data into application memory saved ~30 ms in ad selection and 110 ms in bid preparation; removing redundant serialization cycles took another 20 ms. |
| Infrastructure | "Additional infrastructure changes" | A quantified bucket of its own: parallel encoding, embedding compression, service mesh connections and garbage collection "collectively reduced end-to-end latency by approximately 200 milliseconds". |
| Service mesh | Not broken out | Opening multiple parallel connections per destination reduced latency "by up to 53%" — a percentage, not a millisecond count. Easy to transcribe as 53 ms. |
| Sources | InfoQ summary, October 2026 | Uber engineering blog, 10 September 2026 — both linked above |
One more thing worth noticing, which is our reading rather than Uber's claim: the ads components add up to 160 ms against a stated combined result of about 130 ms. That is not an error. It tells you these savings sit on overlapping paths, so a component ledger is not additive and you cannot reconstruct the 50% from the parts. Treat every published breakdown of this shape the same way.
How to define an Above-the-Fold metric for your own product
An Above-the-Fold-style metric is a wall-clock span from the user's intent to the moment the screen they are waiting for is usable. Defining one for your product takes an afternoon, and the arguments it provokes are the point.
- Name the screen, not the endpoint. Pick the one view where users wait: search results, a dashboard's first chart, an order status page. One number per surface.
- Start the clock at intent. Tap or keypress, not when your client dispatched the request. Everything between — debounce, connection setup, a redirect — is latency the user pays.
- Define completion ruthlessly. Uber's bar is the first screen rendered with images in the viewport. A skeleton loader is not completion. Neither is a result card whose price has not arrived.
- Write down what is excluded. Below-fold cards, lazy carousels, anything a user scrolls to. If you cannot say what is out, the number will drift as the page changes.
- Keep the old metric as a diagnostic. Backend API response time is still how you find a slow query. It is just no longer how you decide whether the product got faster.
Measure it in the field, not in a synthetic test
A lab run cannot produce this number honestly, because the parts a synthetic test holds constant are the parts that hurt. Google's guidance on Largest Contentful Paint — the closest standard analogue, defined as "the render time of the largest image, text block, or video visible in the viewport" — makes the point directly: field measurement includes unload time from the previous page, connection setup, redirects and other time-to-first-byte delays, "which can be significant when measured in the field and can lead to differences between field and lab measurements."
Practically, that means instrumenting the client and shipping the timing back as an event, on a sample of real sessions, segmented by device class and network. A mid-range Android phone on a congested cell is where your metric lives. Budget for the collection path as real work, because an unmonitored metric decays quietly; infrastructure monitoring is where this either becomes a habit or becomes a dashboard nobody opens.
On percentiles: p99 is the right target for a service owner hunting shard jitter, and the wrong headline for a product. Worth noting that Uber never states which percentile its halving refers to — the post says only that the team "cut it in half". The one explicit p99 figure belongs to a future bet, product-based search, where "early testing has already shown more than a 50% reduction in p99 latency". Report a mid percentile for whether the product is fast and a tail percentile for whether it is reliable, and never let one stand in for the other.
Which of Uber's techniques actually generalize
Two of the seven generalize. We checked each against the primary rather than against the headline.
Separating ranking hydration from presentation data. Uber's ranking previously waited on a monolithic hydration phase that fetched scoring signals and display attributes together — prices, promotions, stock status — none of which ranking needs. Splitting it into two parallel phases "removed non-essential data from the critical path, allowing ranking to start earlier and reducing end-to-end latency by 100+ milliseconds." The generalizable form has nothing to do with search: stop fetching display data before the decision that determines which rows you will display. Most teams have a version of this in a list endpoint that joins everything a card might need. It is an API design problem, and it is usually a week of work.
Request hedging. Uber applied it across four presentation hydration dependency layers: past a latency threshold, a duplicate request goes to another instance and the faster response wins, worth 40 ms of aggregate hydration latency. The technique is twenty years old and well documented, so you are not inventing anything.
What does not generalize: product-level embeddings that cut data lookups by over 100 times across a multi-billion-item catalog; a column-oriented ad-serving data layout; GPU model serving with a relevance-model cache; and the agentic AI loop Uber ran against live production latency profiles, which presumes a benchmark harness and an LLM-assisted quality evaluation framework most teams have not built. Admiring those is fine. Planning around them is not.
The costs nobody puts in the summary
Request hedging multiplies backend work, and the canonical source says so plainly. In The Tail at Scale, Dean and Barroso note that "naive implementations of this technique typically add unacceptable additional load", and that deferring the second request until the first has been outstanding past the 95th-percentile expected latency "limits the additional load to approximately 5%". Their BigTable example — a 10 ms hedging delay cutting 99.9th-percentile latency for 1,000 keys from 1,800 ms to 74 ms — cost "just 2% more requests". Those are the good numbers. They are good because of the deferral, not because hedging is cheap.
Uber names the precondition explicitly: hedging "proved highly effective" because "hydration latency was primarily driven by isolated shard jitter rather than correlated slowdowns". Read that as a test you must run before adopting it. If your tail comes from a shared bottleneck — a saturated database, a dependency under load — hedging sends more traffic at the thing that is already failing. The technique turns a slow service into a dead one precisely when you need it most.
Server-side caching of the first screen is a correctness problem before it is a performance one, and Uber's design is more careful than the summaries suggest. Uber returns a smaller initial page and caches the remaining results for scroll requests, avoiding recomputation. The cache holds the continuation of one query, not a shared first screen. That distinction matters, because the attributes Uber split out of ranking hydration — prices, promotions, stock status — are exactly the ones that go stale. A cached page three is a page of items a user may no longer be able to buy. Decide your staleness budget per field, not per page, before you cache anything personalized.
What this looks like on a quick-commerce build
We hit the same gap on FlashNow, a hyperlocal quick commerce platform where orders route to neighbourhood vendors rather than warehouses. The targets we published for it are journey times, not API times: the order flow from first item to confirmed payment was engineered to complete in under two minutes, and saved addresses cut repeat-user checkout to under 30 seconds. Those are Above-the-Fold-shaped numbers — they include rendering, they include the user, and no backend trace produces them.
The discovery screen makes the point sharper. Every store card carries distance, estimated delivery time, categories and live availability, with out-of-stock items suppressed from customer-facing listings. "First screen complete" there means the availability data has landed, because a store card without it is worse than a slower card with it. An endpoint-timing metric would have scored a card that rendered early and lied.
That is the kind of decision we argue about on custom software work: which moment counts as done, agreed before anyone optimizes toward it.
Where this is the wrong advice
If your product has no waiting screen — a batch job, an internal API, a webhook consumer — Above-the-Fold is meaningless and backend latency is your real metric. If your search is slow because one query plan is wrong, you need a profiler, not a measurement framework. And if you have no field instrumentation at all, building the collection path is the project; adopting the metric before you can observe it just moves the fiction.
For everyone else the sequence is cheap and specific. Pick the screen users wait on, instrument it on real sessions, publish the number next to your existing API latency chart for a month, and watch which one moves when you ship. If they disagree, you have found the work. Uber found roughly 200 milliseconds of it in the rendering path alone.
Frequently asked questions
Uber Eats halved end-to-end search latency through parallel workstreams across the full stack, not one change. The largest single wins were roughly 120 milliseconds from deleting low-yield retrieval strategies, over 100 milliseconds from splitting hydration, and over 200 milliseconds of Above-the-Fold gain from pagination and asynchronous rendering.
Above-the-Fold completion is the time from query submission to when the first screen of results is fully rendered with images in the viewport. Uber adopted it over backend API response time because API latency can improve with no visible difference when the bottleneck sits in payload transfer, template rendering or image loading.
Request hedging does cost more compute, because a duplicate request is sent while the first is still outstanding. Dean and Barroso report that deferring the hedge until past the 95th-percentile expected latency holds the extra load near 5 percent, and that naive implementations add unacceptable load.
The p99 latency figure is the right target for finding tail problems such as shard jitter, but the wrong headline for product speed. Report a mid percentile for whether a product feels fast and a tail percentile for whether it is reliable, and never let one stand in for the other.
Measure perceived search speed in the field, not in a lab: instrument the client, start the clock at the user's tap, stop it when the first screen is rendered with images, and sample real sessions segmented by device class and network. Lab runs exclude the delays that dominate real results.