OpenTelemetry migration at 100,000 hosts: Atlassian's approach
Atlassian's OpenTelemetry migration covered 100,000 hosts and 4.8 billion datapoints a minute. It worked because services never had to change how they emit.
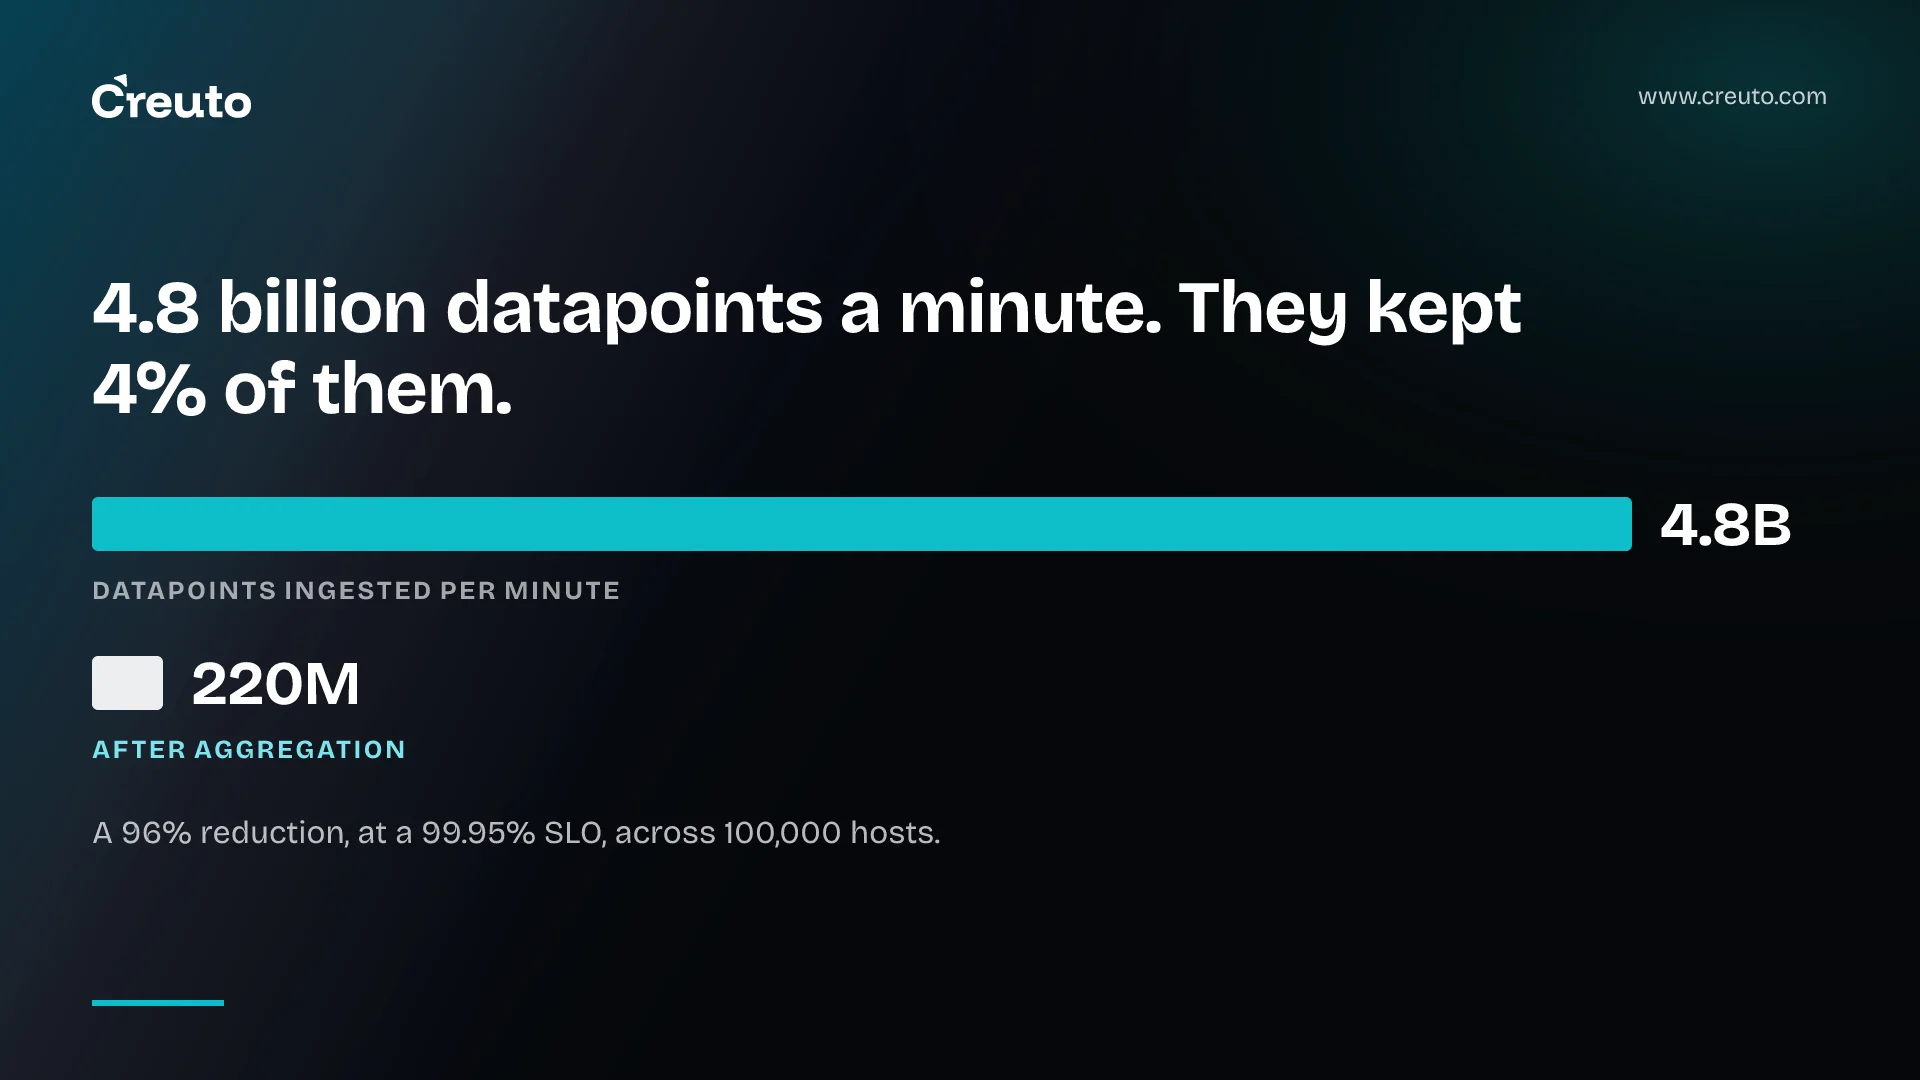
Atlassian moved a metrics platform spanning about 100,000 hosts across 14 regions from gostatsd to the OpenTelemetry Collector. The most useful sentence in their account is not a figure. It is the strategy: they kept the interface and rebuilt everything behind it, which turned an org-wide migration into a platform-team migration. Anyone planning an OpenTelemetry migration should start from that sentence rather than from the collector documentation.
The scale
The CNCF write-up published on 17 September gives the numbers. The platform ingests roughly 4.8 billion datapoints per minute, aggregates them down to about 220 million — a 96% reduction — and runs to a 99.95% service level objective.
At that volume, every design decision shows up as either CPU or an incident. Which is what makes the problems they hit, and how they fixed them, more instructive than a vendor benchmark.
Keep the interface, change the plumbing
The expensive way to migrate a shared platform is to ask every service team to change how they emit data. It needs hundreds of teams to prioritise work that benefits someone else, and the migration moves at the pace of the slowest team with the fullest roadmap.
Atlassian avoided that. Services kept emitting metrics the way they already did, and the platform team replaced everything downstream. The practical consequence is that the migration could be scheduled, staged and rolled back by one team, rather than negotiated with an entire organisation.
This pattern is not specific to observability. It is the right default for almost any platform modernisation: payment gateways, identity providers, message brokers, internal APIs. Change the implementation behind a stable contract first, and only change the contract once the new implementation has proven itself.
There is a cost to this approach worth naming. Keeping the old interface means the new platform has to speak the old protocol, including its quirks, for as long as any service still uses it. Atlassian accepted a compatibility burden on the platform side in exchange for not imposing one on every product team. For a platform team that is almost always the right trade, because the burden sits with the people who understand it best and the rest of the organisation keeps shipping.
Four collectors, not one
Rather than a single general-purpose deployment, Atlassian built four purpose-built OpenTelemetry Collector distributions, one for each pipeline stage: collection, ingest, aggregation and forwarding.
The Collector is designed for this. It is assembled from receivers, processors and exporters, and a distribution containing only the components a stage needs is smaller, easier to reason about and easier to tune independently. Splitting by stage means a change to aggregation logic does not require redeploying the agents running on 100,000 hosts.
The problems, and the fixes
Hot shards. Routing by service produced uneven load, because some services emit vastly more metrics than others. The fix was to hash on stream ID in the load-balancing exporter instead of on service, which spread CPU evenly across the shard pool. It is a small change with a general lesson: shard on the thing whose volume is actually uniform, not on the thing that is convenient to name.
Sidecar cost. Services had been running separate sidecars for StatsD metrics and for tracing. Consolidating both into a single OpenTelemetry Collector saved about 3.9% CPU per service on premium instances, which added up to a 30% reduction in sidecar cost across the fleet. At 100,000 hosts, a few per cent per service is a meaningful budget line.
Delta aggregation. Atlassian wrote a custom delta aggregation processor, open-sourced it, and cut CPU in the aggregation tier by roughly half.
Removing the old layers. The gostatsd aggregators and a Nomad proxy had together accounted for about 38% of the metrics cluster's CPU requests, with the proxy alone at around 13%. Both are now gone.
What an OpenTelemetry migration looks like at normal size
Almost nobody reading this runs 100,000 hosts. The lessons still apply at a hundred.
Consolidate agents. The most common observability setup we see in mid-sized estates has a logging agent, a metrics agent and a tracing agent on every node or pod, each configured by a different person in a different year. One collector handling all three signals is cheaper to run, cheaper to operate and removes a class of version drift.
Standardise on the open protocol before changing vendors. If your services emit OpenTelemetry, changing the backend is a configuration change in the collector. If they emit a vendor's proprietary format, it is a code change in every service. That asymmetry is the strongest argument for OpenTelemetry, and it is independent of scale.
Watch cardinality as closely as volume. Atlassian's 96% reduction through aggregation is a reminder that most raw datapoints are not worth storing individually. The same theme runs through the recent move to native histograms in Kubernetes and through the warning against putting session identifiers into metric labels in agent observability. Observability cost is mostly a cardinality problem.
Migrate behind the contract. The biggest saving in this story is organisational, not computational. A migration that one team can own finishes. One that needs every team rarely does — which is the same reason large platform changes succeed or stall depending on how much of the organisation they drag along.
If your monitoring stack has grown by accretion and nobody can say what each agent costs, the audit is usually quick and the savings are usually real. That work sits squarely in infrastructure monitoring, and Atlassian's approach — stable interface, staged replacement, measure every tier — is how we would run it.
Frequently asked questions
Atlassian kept the metrics interface services already used and rebuilt the platform behind it, replacing gostatsd with four purpose-built OpenTelemetry Collector distributions for collection, ingest, aggregation and forwarding. That made the migration a platform-team project rather than an organisation-wide one.
It spans about 100,000 hosts across 14 regions, ingests roughly 4.8 billion datapoints per minute, aggregates them to about 220 million per minute — a 96% reduction — and runs to a 99.95% service level objective.
Combining separate StatsD and tracing sidecars into one OpenTelemetry Collector saved about 3.9% CPU per service on premium instances, which amounted to a 30% reduction in sidecar costs across Atlassian's fleet.
Atlassian found that routing by service created uneven load because some services emit far more metrics. Hashing on stream ID in the load-balancing exporter instead distributed CPU evenly across the shard pool.
Asking every service team to change how they emit data makes the migration depend on the slowest team's priorities. Keeping the contract stable lets one platform team stage, schedule and roll back the change, which is why such migrations actually finish.
Yes. Emitting OpenTelemetry means changing observability vendor becomes a collector configuration change rather than a code change in every service, and one collector handling logs, metrics and traces replaces several separately maintained agents.