Kubernetes overprovisioning: three numbers, three fixes
The kubernetes overprovisioning figures everyone quotes measure three different things: idle cost, allocation versus requests, and requests versus usage.
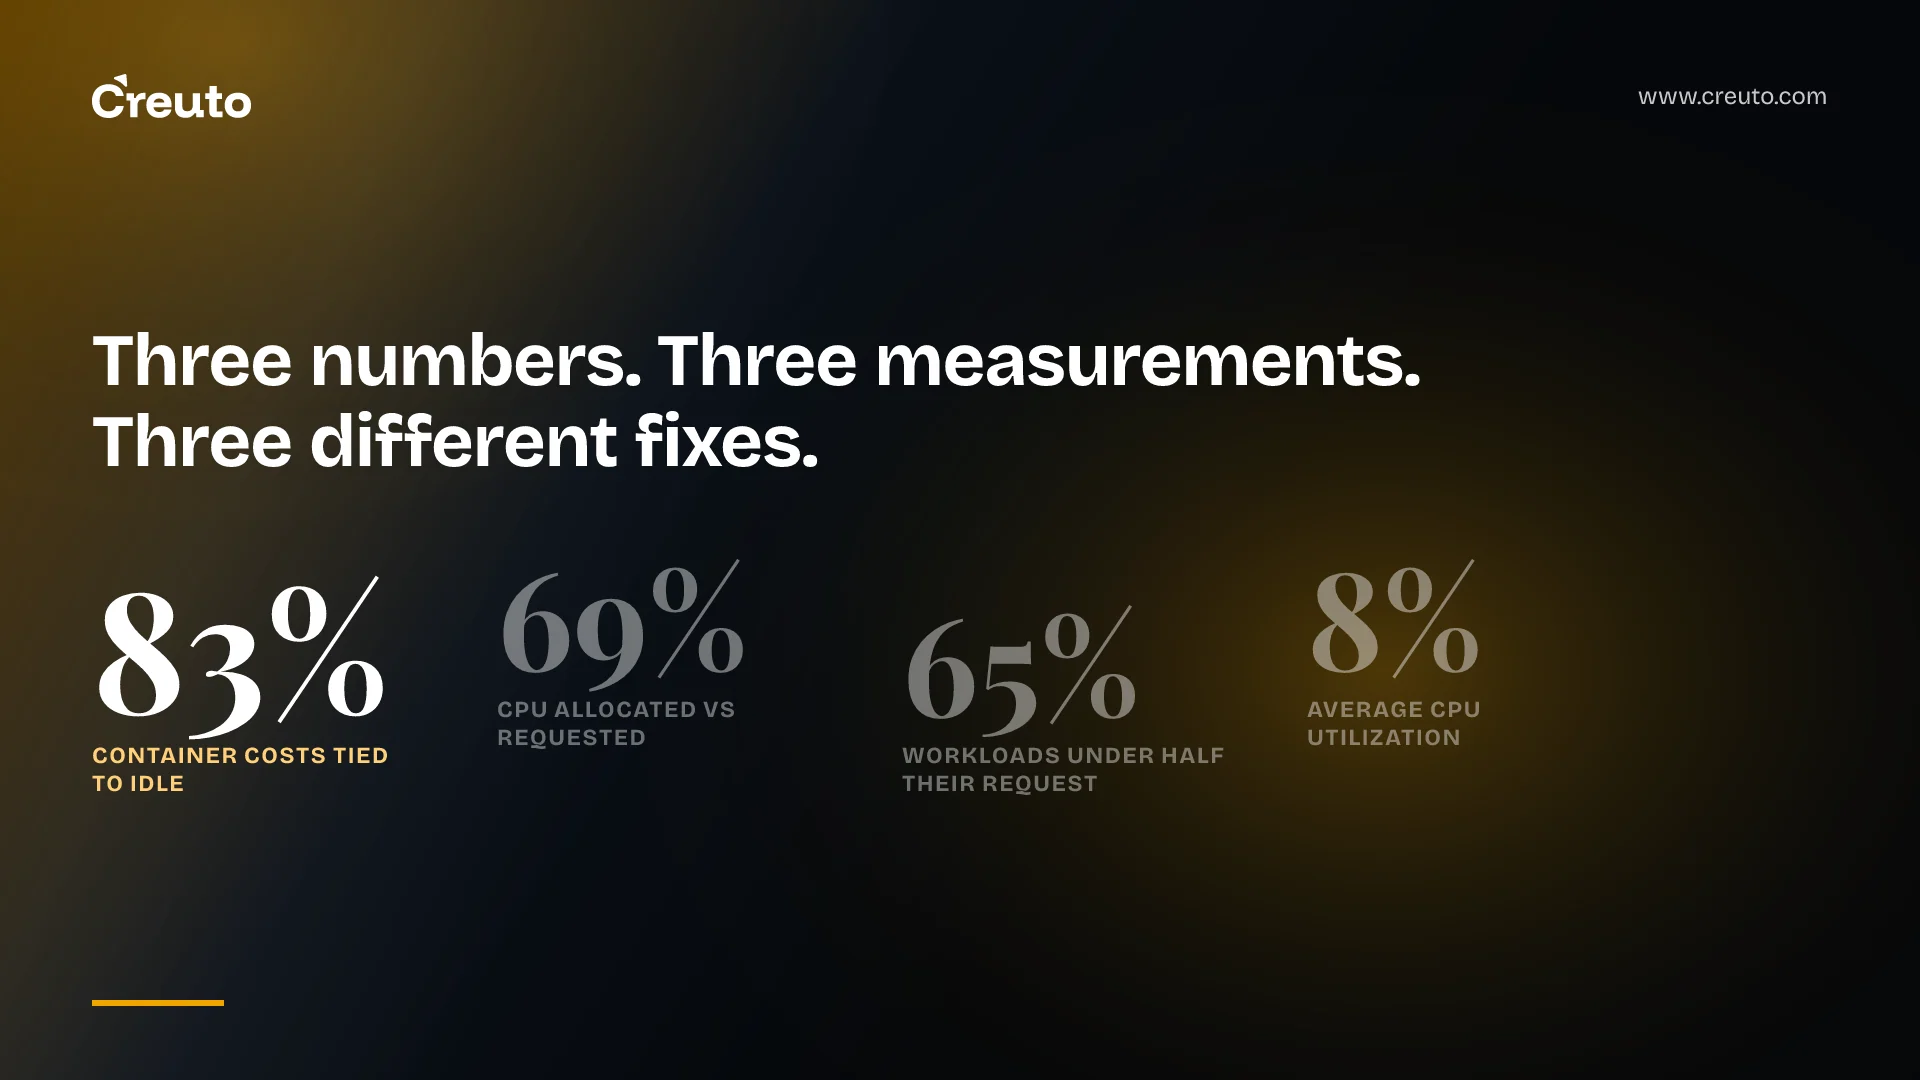
The number everyone quotes for kubernetes overprovisioning — 83% of container costs tied to idle resources — is genuine Datadog research, but it is not in the Datadog container report it is almost always credited to. Three figures circulate in cluster cost arguments, they measure three different things, and each one points at a different fix.
Here is what each one actually measures, and what it tells you to change:
| Figure | What it measures | What it implies you fix |
|---|---|---|
| 83% of container costs tied to idle resources (Datadog, State of Cloud Costs 2024) | The cost of provisioned capacity nobody used | Node sizing and request sizing, with node sizing the larger share |
| CPU overprovisioning 69%, memory 79% (Cast AI, 2026) | The gap between what is allocated and what workloads ask for | Allocation and node pool shape — not usage |
| Over 65% of workloads use under half their requested CPU and memory (Datadog container report, November 2023) | Resource requests against measured usage | Pod resource requests |
Those are not three estimates of one quantity. They are three quantities. Averaging them, or quoting one as evidence for a fix the other implies, is how cost programmes end up re-packing nodes when the problem was padded requests.
The 83% figure is real — just not from the report it is credited to
We went looking for it in Datadog's container report, which is where almost every blog post and vendor deck attributes it. It is not there. The November 2023 edition, which is what the container report URL currently serves, contains no such figure, and neither do the 2022 or 2021 editions. More to the point, those reports do not measure spend at all — they measure utilization, container counts and orchestration patterns.
Being precise about the limits of that check: we read the 2023 edition in full, and the 2022 and 2021 editions verbatim for roughly their first 39,400 characters, with the remainder read as summary. Within that, no 83% idle-spend figure appears.
The figure's actual home is a different Datadog publication. The 2024 edition of State of Cloud Costs says plainly: "Our research shows that 83 percent of container costs are associated with idle resources." Its findings are "based on data collected between May 2023 and April 2024". Datadog used the same figure in its 26 June 2024 announcement of Kubernetes Autoscaling, attributing it to that report.
So the statistic survives, and the correction is narrow: right vendor, right research, wrong report. But the attribution matters more than pedantry usually does here, because the useful part of the finding is the part nobody quotes.
The split inside the 83% is the part worth keeping
Datadog breaks the idle cost into two buckets. Cluster idle, "the cost of overprovisioning cluster infrastructure", is the larger at 54%. Workload idle, which comes from resource requests larger than workloads need, accounts for 29%. One caveat on reading those two: the page words them as shares of the wasted spend, while 54 and 29 sum to exactly 83, so treat them as the balance between the two causes rather than a precisely defined denominator.
Either way the ordering is the signal. Most of the money is sitting in capacity that was provisioned and never allocated to anything — nodes too large or too numerous for what is scheduled on them — rather than in requests that are individually too generous. Datadog is also candid that it does not expect the waste to go to zero, because resource needs are hard to forecast and change over time.
What kubernetes overprovisioning means in Cast AI's report is not idle capacity
Cast AI's 2026 State of Kubernetes Resource Optimization, published 21 April 2026, reports that average CPU utilization across sampled clusters was 8% in 2025, down from 10%, and memory 20%, down from 23%. It adds that CPU overprovisioning rose from 40% to 69% year over year, with memory overprovisioning at 79%.
That 69% is the figure most often lifted into cost decks as a waste number. It is not one. The report itself defines the gap it is measuring as "the difference between what is allocated and what workloads ask for" — allocation against requests, not requests against usage.
Work through what that definition does to two clusters. A team that has rightsized every request honestly but runs loose bin packing on oversized node pools scores badly on it. A team whose requests are wildly padded but whose scheduler packs those requests tightly onto nodes scores well. The metric is reading allocation efficiency — closer to Datadog's cluster idle bucket than to anything about pods using less than they asked for.
What the sample is, and what it is not
The methodology is stated: "analysis of tens of thousands of Kubernetes clusters across AWS, GCP, and Azure, covering January 1 to December 31, 2025, and until April 2026 for GPU utilization". Critically, "all utilization data was collected before these organizations enabled Cast AI's automation features", which the report presents as a clean baseline.
It is a baseline, and it is also a selected one. Cast AI sells rightsizing and autoscaling. The report never says the sample is Cast AI customers only, so read this next part as our inference rather than a stated fact: a population defined as organizations measured before they switched on Cast AI's automation is, by construction, organizations that went on to buy or trial Cast AI. Companies shop for rightsizing automation when they suspect they need it. Treat 8% and 69% as vendor telemetry from a customer base, not as the industry average.
Two further things the report does not give you: the actual cluster count beyond "tens of thousands", and how utilization is computed or whether averages are request-weighted. It also stretches once, describing real utilization falling from 10% to 8% as meaning raw cloud waste rose by a fifth — but 10% to 8% is the CPU series, and memory's 23% to 20% is a separate one.
The reliability counter-argument, in its strongest form
The report takes a position worth stating properly before answering, because it is the objection every platform engineer will raise: padded requests are not sloppiness, they are insurance. A request sized to the p50 gets you CPU throttling under load and OOMKilled pods during a deploy or a traffic spike. The cost of one incident, in engineering hours and customer trust, dwarfs a few thousand dollars of idle nodes, and the engineer who cut the request owns the outage.
That argument is correct about consequences and wrong about method. It is a case for measuring before you cut, for sizing against observed peaks rather than averages, and for leaving headroom you chose deliberately. It is not a case for never looking. The teams we see get burned are the ones that cut requests from a spreadsheet of averages, not the ones that measured.
The only number you can reproduce is requests versus usage
Of the three, Datadog's container report figure is the one you can recompute on your own cluster, because it publishes its arithmetic. Over 65 percent of Kubernetes workloads use less than half of their requested CPU and memory, derived by "computing the hourly average of CPU or memory used by each container and dividing it by the hourly average of its resource request", compiled over multiple days, with the Datadog Agent and Kubernetes pause containers excluded. The population was tens of thousands of companies and more than 2.4 billion containers, and Datadog states the limitation itself: "the data comes from our customer base, a large but imperfect sample of the entire global market."
One freshness note before you lean on it. That page reads "Updated November 2023" and refers to the previous edition as published in November 2022, yet it is routinely cited as current — as of November 2026 the figure is three years old, and the © 2026 footer is a site notice, not a publication date.
How to measure kubernetes overprovisioning on your own cluster this week
Reproducing the requests-versus-usage ratio is a short piece of work, and it gives you a defensible number instead of someone else's average:
- Confirm kube-state-metrics is running and exposing
kube_pod_container_resource_requests, the gauge carrying each container's request withresourceandunitlabels. The kube-state-metrics documentation notes that kube-scheduler's ownkube_pod_resource_requestis more precise and recommends it where available. - Take usage from metrics-server, or from the cAdvisor counters your monitoring already scrapes if you want multi-day history rather than a point-in-time reading.
- Compute the ratio per container as an hourly average over several days, not a single snapshot, and exclude pause containers and your agent pods. Matching Datadog's method is what makes your number comparable to theirs.
- Install the Vertical Pod Autoscaler with
updateMode: "Off". In the project's own words, "UpdateModeOff means that autoscaler never changes Pod resources" while "the recommender still sets the recommended resources in the VerticalPodAutoscaler object", which the API documentation describes as a dry run. VPA is an add-on, not built in, and needs Metrics Server. - Diff each workload's VPA recommendation against its current request. That delta, summed and priced, is your request-rightsizing opportunity — the honest version of the 65% figure for your estate.
Two limits to plan around. VPA does not support resizing pods in place as of Kubernetes 1.37, so acting on recommendations means pod recreation and a rollout. And a recommendation computed over a quiet fortnight will under-size anything seasonal, which is exactly how the reliability objection above comes true. If a workload has a known peak, size to the peak and let the number be what it is. Getting these metrics in front of the teams who own the workloads, rather than keeping them in a platform dashboard, is its own piece of work — we wrote about letting teams query their own metrics in a multi-tenant Prometheus for that reason.
Should you fix node sizing or pod requests first?
Fix node sizing first, if Datadog's 54/29 split holds for your cluster — and measure whether it does before you assume it. More of the money is in cluster idle than in workload idle, and node-level waste is usually easier to recover because it does not require touching a single application manifest or asking a product team for a maintenance window.
The sequencing has a trap, though, and it runs the other way. Cutting requests without re-packing the cluster recovers nothing. Smaller requests leave more allocatable capacity on the same nodes, and unless the Cluster Autoscaler can then remove nodes or you resize the node pool, you have improved a ratio and kept the bill. That is the mechanism behind Cast AI's allocation gap widening while utilization falls: both numbers move, no invoice does. Do the request work to make nodes removable, then remove them.
This is the wrong order in two cases. If you run a small number of large stateful workloads pinned to dedicated node pools, request rightsizing does almost nothing and node pool shape is the entire conversation. And if your spend is concentrated in GPU nodes, none of the three figures above applies — Cast AI reports GPU utilization at 5% on a different definition entirely, and the economics of GPU utilization in Kubernetes clusters running AI inference are their own problem, which we have covered separately. Compute is also not the only recoverable line: storage left behind by deleted workloads is a quieter cost, and the new Unused condition on PersistentVolumeClaims in Kubernetes 1.37 makes it findable.
Start from a number you can defend in the review
When a cost-reduction target lands on a platform team, the fastest route to a credible plan is not a benchmark from a vendor report. It is a week of measurement on your own cluster: the requests-versus-usage ratio computed Datadog's way, a VPA dry run per workload, and the allocation gap read separately from both so you know which of the two fixes your money is actually sitting in. That gives you a figure with your cluster's name on it, which is the only kind that survives a finance review.
If you have been handed that target and want the baseline built properly before anyone changes a node pool, our DevOps and cloud engineering team does exactly this sequencing — measurement first, recommendation-only autoscaling second, node pool changes last — and we scope Kubernetes implementation and cluster work against what the measurement finds rather than against an industry average.
Frequently asked questions
Datadog's State of Cloud Costs 2024 report found 83 percent of container costs are associated with idle resources, split between cluster idle at 54 percent and workload idle at 29 percent. That figure comes from Datadog's customer data gathered between May 2023 and April 2024, so treat it as a starting hypothesis to test on your own cluster.
No. The 83 percent figure is Datadog's, but it appears in the State of Cloud Costs 2024 report, not the container report it is usually credited to. The container report measures utilization and container counts, not spend, and no edition we read contains an 83 percent idle-spend figure at all.
Cast AI's 2026 report puts average CPU utilization across its sampled clusters at 8 percent for 2025, down from 10 percent, with memory at 20 percent. That sample is organizations measured before they enabled Cast AI's own automation, so it reads as vendor telemetry from a customer base rather than an industry average.
Not in Cast AI's report, which defines overprovisioning as the difference between what is allocated and what workloads ask for. That is allocation against requests, not requests against usage, so a cluster with honest requests and loose bin packing scores badly on it despite wasting nothing at the pod level.
Take resource requests from kube-state-metrics, take usage from metrics-server or cAdvisor, and compute the hourly average ratio per container over several days, excluding pause containers. Then run the Vertical Pod Autoscaler with updateMode set to Off, which produces recommendations without changing any pod resources.
Start with node sizing if your cost breakdown resembles Datadog's, where cluster idle is the larger share. Cutting pod requests alone recovers nothing on its own, because freed capacity stays on the same nodes until the Cluster Autoscaler removes them or you resize the node pool deliberately.