App development company India: the rate cards disagree
App development company India rates contradict each other: Clutch's own two guides say under $25 and $25-49 an hour. What to vet instead of a rate.
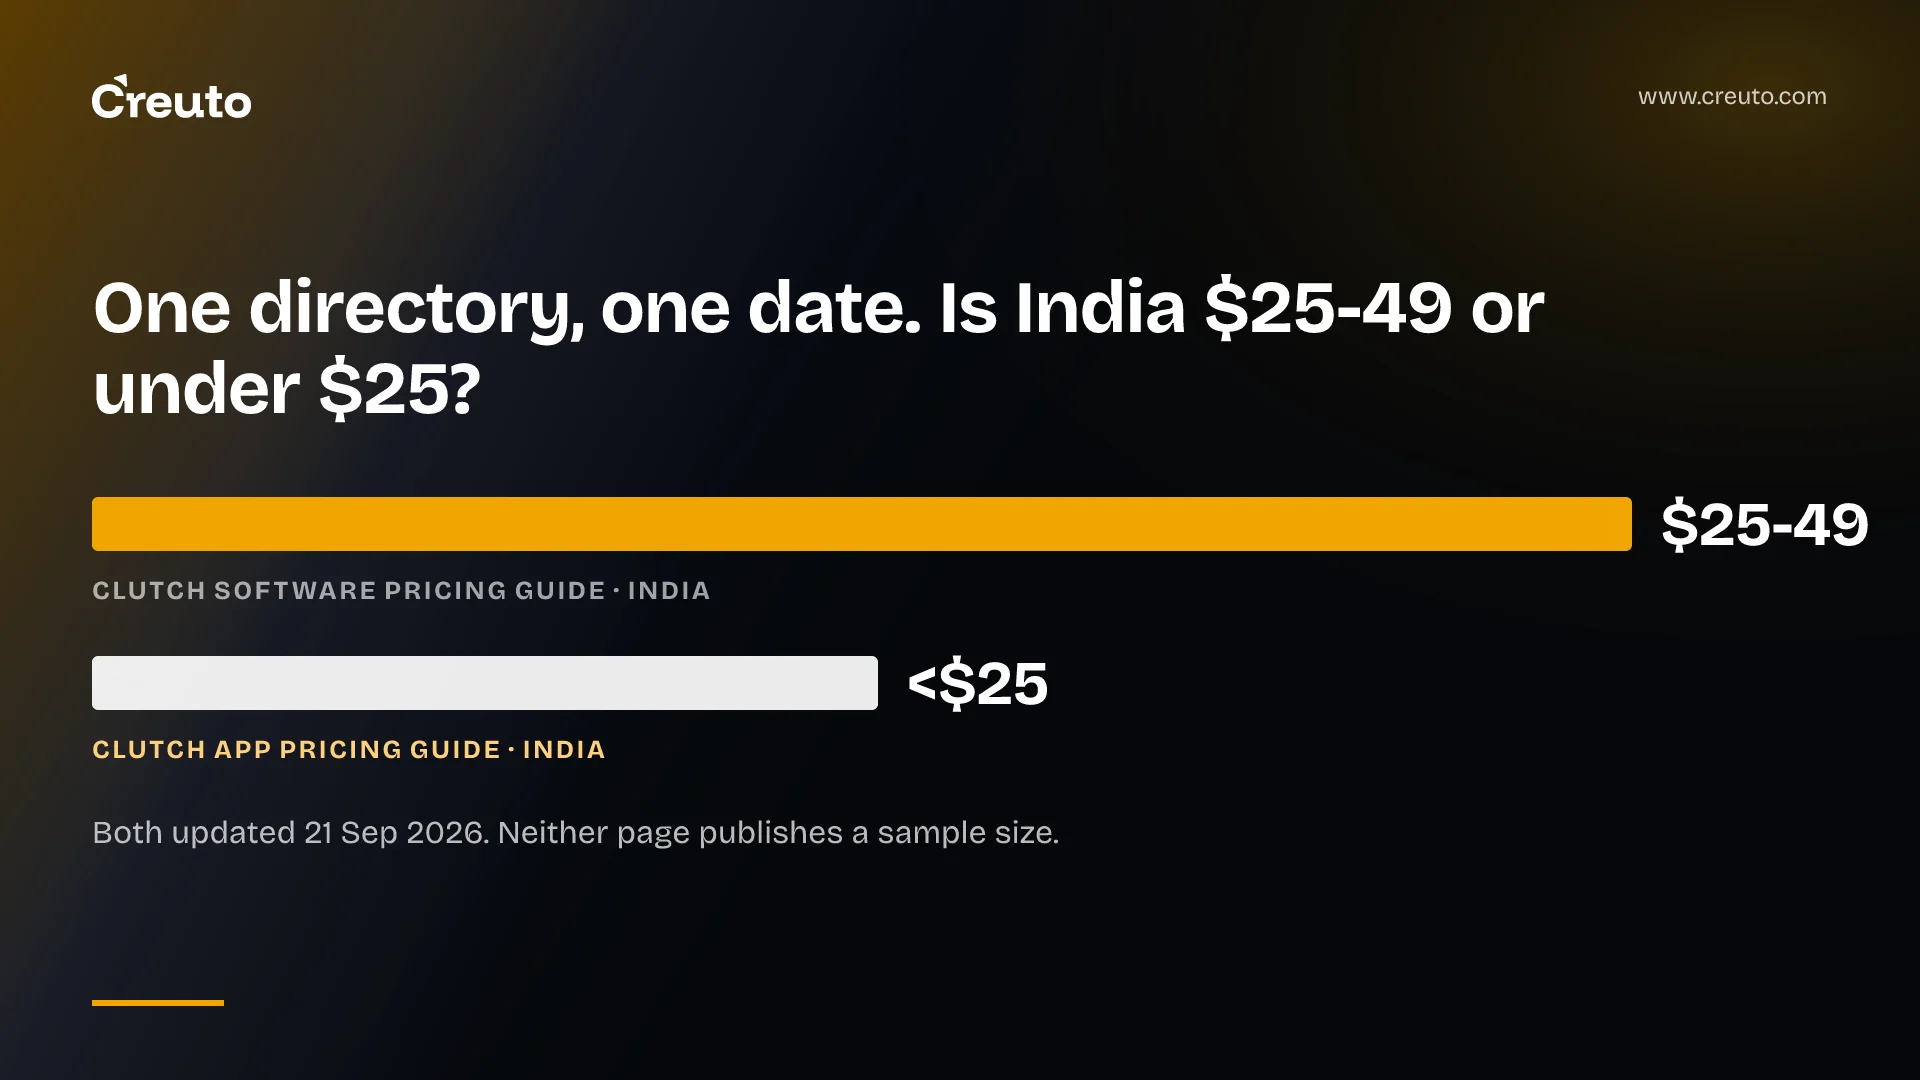
On 21 September 2026 Clutch updated two pricing guides on the same domain. Its software development pricing guide puts India at $25–$49 an hour. Its mobile app pricing guide puts India under $25 and the United States at $25–$49 — beneath its own Canada band on the same page. Search app development company India and you will meet both numbers.
Neither page publishes a sample size. Both label the country table “Countries ranked by Clutch traffic”, and both list the United Kingdom as “Unknown”. So this post does not give you a rate to aim for. It gives you the five things that are actually measured or contractually fixable — contract shape, named people, IP assignment, overrun exposure and time-zone overlap — and the paper trail to demand for each.
Clutch's own two guides disagree about India, on the same date
Here is what the published sources said when we read them in October 2026. The last row is deliberately the odd one out.
| Source and date | India | United States | Sample size published |
|---|---|---|---|
| Clutch, software development pricing guide, updated 21 Sep 2026 | $25–$49/hr | $50–$99/hr | None stated |
| Clutch, mobile app pricing guide, updated 21 Sep 2026 | Under $25/hr | $25–$49/hr | None stated |
| Accelerance, 2026 outsourcing rate trends, 24 Nov 2025 | No India figure. Asia: $24–$31 junior, $31–$41 senior | Not given on the same basis | 60 partners |
| Stack Overflow 2025 — salary, not a billing rate | $22,086 median back-end | $175,000 median back-end | 1,093 India / 5,239 US respondents |
The two Clutch pages are not slightly apart. For India they differ by a band; for the United States they differ by a band and produce an ordering no buyer would recognise, with the US under Canada and far under Australia. Both pages also carry the same headline average — “around $25–$49/hour” — while their country tables disagree underneath it. Each states that its pricing comes from verified first-party client reviews: a provenance claim, not a sample size.
Accelerance's 2026 rate survey is more careful and less useful for this question: it surveys 60 software development partners and reports Asia at $24–$31 for junior developers and $31–$41 for seniors, against Europe at $64–$76 and Latin America at $60–$75 for seniors. It notes Asia's effective rates dropped nearly 8% in the last year, and gives no India figure at all — India appears only as an example of a large talent pool.
Why an app development company India rate card cannot be your filter
A rate card is only a filter if it discriminates. Three independent problems stop these ones from doing that.
First, no denominator. A band with no sample size and no dispersion cannot tell you whether $25 is the median, the floor or one outlier review. Second, self-selection: the rates come from clients who wrote reviews, ranked by site traffic, which is a marketing metric rather than a sampling frame. Third, the unit is not comparable. An hour from a studio that includes design, QA, DevOps and a product owner is not the same good as an hour from a body shop that bills each of those separately or not at all.
Salaries are not billing rates, and conflating them misleads in both directions
Stack Overflow's 2025 developer survey reports median yearly salary in USD for back-end developers of $22,086 in India, $108,913 in the United Kingdom and $175,000 in the United States. Those are employee salaries. They are not what a firm charges you, and dividing them by 2,000 hours to “derive” a rate is wrong twice over.
It understates the real cost, because a billing rate also carries employer taxes, benefits, recruitment, bench time, office and cloud costs, management and margin. And it overstates the saving, because the ratio between two salary medians is not the ratio between two quotes — the Indian firm quoting you is competing against other firms, not against its own payroll. Treat the salary gap as evidence that a cost difference exists, and nothing more precise.
What is actually measured is overrun risk, and it is worse than the averages suggest
While the price data is unsourceable, the risk data is good, and it points somewhere specific. Flyvbjerg and Budzier's analysis of 1,471 IT projects found an average cost overrun of 27% — and then showed that the average is the least interesting number in the set. One in six projects in the sample was what they call a Black Swan, with a cost overrun of 200% on average and a schedule overrun of almost 70%.
Their 2025 follow-up in Project Management Journal compares 23 project types across 11,011 projects, 5,360 of them IT. Its headline figure is routinely misreported. The 40.86% in its table is the share of IT projects that overran at all — and the paper's own point is that this is one of the lowest frequencies of the 23 types, below aerospace at 90.72% and nuclear power at 96.94%. IT is not unusually likely to go over. It is unusually likely to go catastrophically over.
The numbers that matter are the tail ones. 18.26% of IT projects overran by more than 50%, and those projects averaged a 453% overrun. IT is the only one of the 23 types with a tail parameter at or below 1, which the authors describe as infinite mean and variance — unpredictable cost risk, more extreme than nuclear waste storage. Their phrasing is blunt: your base rates are an 18.26% risk of ending up in the tail with an expected overrun of 453%, and a substantial risk of more.
Read that against the rate cards. A band difference between $25 and $49 an hour is a factor of two on the labour line. A tail event is a factor of five on the whole project. If you optimise the first and ignore the second, you have spent your diligence budget on the smaller number.
Contract shape decides who absorbs the overrun
Three structures dominate, and the only question that matters is which party carries scope risk.
- Fixed scope, fixed price. The vendor carries overrun on everything inside the written scope. That protection is exactly as wide as the specification, which is why the change-request process, not the price, is the clause to read.
- Dedicated team, time-based. You carry overrun. You buy capacity, and you own the estimate. This is the honest structure for genuinely unclear work, and the wrong one if you cannot staff a product owner to direct it weekly.
- Retainer or support. Suited to a maintained, live system with a steady flow of small work. It is not a delivery vehicle for a new build, and a retainer sold as one is a dedicated team without the accountability.
Scope change is the common failure mode across all three. PMI's 2018 Pulse of the Profession reported that 52% of projects completed in the previous 12 months experienced scope creep, up from 43% five years earlier. That figure is eight years old and self-reported, so treat it as an order of magnitude rather than a rate: scope changes on roughly half of projects. Ask who pays when it does, in writing, before the kickoff call.
Deloitte's 2024 Global Outsourcing Survey, drawing on more than 500 executives globally, found that 70% had selectively insourced scope that was previously with a third party over the last five years. That is not an argument against outsourcing. It is an argument for writing the exit before you write the cheque: who owns the repository, the build pipeline, the infrastructure accounts and the documentation on the day you take a module back.
Who does the work, and whether they can be swapped after you sign
We have no survey data on post-signing staff substitution, and we are not going to invent a percentage for it. What we can tell you is that it is a contract term, and that most contracts are silent on it.
Ask for the named individuals who will be on your project, with their actual CVs, annexed to the agreement as a schedule. Then ask for three things in the clause: that named key personnel cannot be replaced without your written consent; that a replacement must be of equivalent or better seniority, evidenced before the swap; and a notice period. If a firm will not name anyone, you are buying a rate, not a team. If it names people in the pitch and declines to annex them, you have learned something more useful than any rate card tells you.
The same applies to subcontracting. Ask whether any work will be performed outside the contracting entity, and require that every obligation you have just negotiated flows down to anyone who touches the code.
IP assignment is a clause, not an assumption
Buyers routinely assume they own what they paid for. In practice, ownership depends entirely on the words, and we have no data on how often disputes arise — only vendor opinion, which we will not dress up as evidence. Pin down the following, and get the answers in the draft rather than in an email:
- What is assigned, and when. Present assignment of all deliverables and work product, effective on creation — not on final payment, which leaves you holding nothing if the engagement ends mid-stream.
- Everything, not just the code. Designs, prototypes, data models, test suites, infrastructure-as-code, CI configuration, and the documentation.
- Pre-existing and third-party material. A schedule listing every framework, library, template or internal tool carried in, with its licence, and a licence to you for anything retained by the vendor.
- Open-source compliance. A bill of materials and a warranty that no copyleft licence has been introduced into your proprietary codebase without flagging it.
- Moral rights and personnel. A waiver where the jurisdiction recognises them, and confirmation that every employee and contractor has assigned their rights to the vendor in the first place. A vendor cannot assign what its own developers still own.
- Repository access from day one. Code in your organisation's version control, not handed over at the end. Handover is not a milestone; it is a symptom.
Time-zone overlap belongs in the same category: real, consequential, and with no credible published failure rate. So specify it instead of estimating it. Contract a minimum number of overlapping working hours per day, name the ceremonies inside that window, and name the person who answers during it. India to the UK is a few hours of overlap by default and most of a working day if you ask; India to the US west coast is a deliberate arrangement or it is nothing.
What we do instead of publishing a rate
We do not publish fixed prices, and this post would be dishonest if it criticised unsourceable bands and then gave you one. Cost depends on scope, the number of platforms, integrations, compliance needs and timeline. After a free discovery call you get a fixed-scope proposal with a budget breakdown, milestones and a timeline for your product. We will not quote from a one-line brief, and you should be wary of anyone who will.
What we will put numbers on is delivery. A focused MVP typically takes 6–10 weeks; larger enterprise platforms run 3–6 months depending on complexity, integrations and scope. For Škoda Auto we built three platforms and four AI-powered features serving 100+ dealerships, 20 weeks to market. Those are the figures we can be held to, and the kind you should ask any firm to put in a schedule. We have written separately about why we won't quote a range, and about where we work.
If you are scoping custom software development or mobile app development with an offshore partner, the rate is the last thing to negotiate, not the first.
The questions to send before you compare a single rate
Send these to every shortlisted firm in writing, and compare the answers rather than the numbers. A firm that answers all eight clearly has told you more than any directory can.
- Which contract structure are you proposing, and who pays for scope change under it?
- Name the individuals on this project, and annex their CVs. Can they be replaced without my consent?
- Will any work be subcontracted outside your legal entity?
- When does IP assignment take effect — on creation, or on final payment?
- List pre-existing and third-party components you will carry in, with licences.
- Which of our accounts — repository, cloud, CI — will hold the work from week one?
- How many overlapping working hours per day, and who is reachable in them?
- What happens to the code, infrastructure and documentation if we terminate at month three?
Your next decision is not what to pay. It is whether you can get those eight answers in a draft contract before you commit to a kickoff date — because every one of them is cheap to fix now and expensive to discover in the tail.
Frequently asked questions
There is no reliable published figure. Clutch's own two 2026 pricing guides put India at $25-$49 an hour on one page and under $25 on the other, both updated 21 September 2026, and neither states a sample size. Accelerance's 60-partner survey gives no India rate at all.
Vet an offshore development company on contract structure, named personnel annexed to the agreement, when IP assignment takes effect, subcontracting, contracted time-zone overlap and the exit terms. Each of those is verifiable in a draft contract before you commit, which no published hourly rate is.
The labour line is cheaper; the total depends on overrun. Research on 1,471 IT projects found one in six ran to a 200% cost overrun, and a 2025 follow-up found 18.26% of 5,360 IT projects overran by more than 50%, averaging 453%. Contract structure decides who absorbs that.
Use fixed scope and fixed price when the specification is genuinely settled, and a time-based dedicated team when it is not and you can staff a product owner weekly. A retainer suits a live maintained system, not a new build. The change-request clause matters more than the price.
Published India rates vary because the bands have no denominator. Clutch's tables are ranked by its own site traffic and drawn from client reviews, with no sample size or dispersion published, and an hour that includes design, QA and DevOps is not the same unit as an hour that excludes them.
No. Stack Overflow's 2025 median back-end salaries of $22,086 in India and $175,000 in the US are employee pay, not billing rates. Dividing them by working hours ignores employer taxes, benefits, bench time, management and margin, and the salary ratio is not the quote ratio.
It should assign all deliverables and work product on creation rather than on final payment, cover designs, data models, tests and infrastructure code as well as source, schedule every pre-existing and third-party component with its licence, and confirm the vendor's own staff assigned their rights first.