AI generated code technical debt: the study cut its number
AI generated code technical debt study v3 cut its per-tool rate from over 15% to 7.5-14.8%. What changed, what still holds, and what it can't tell you.
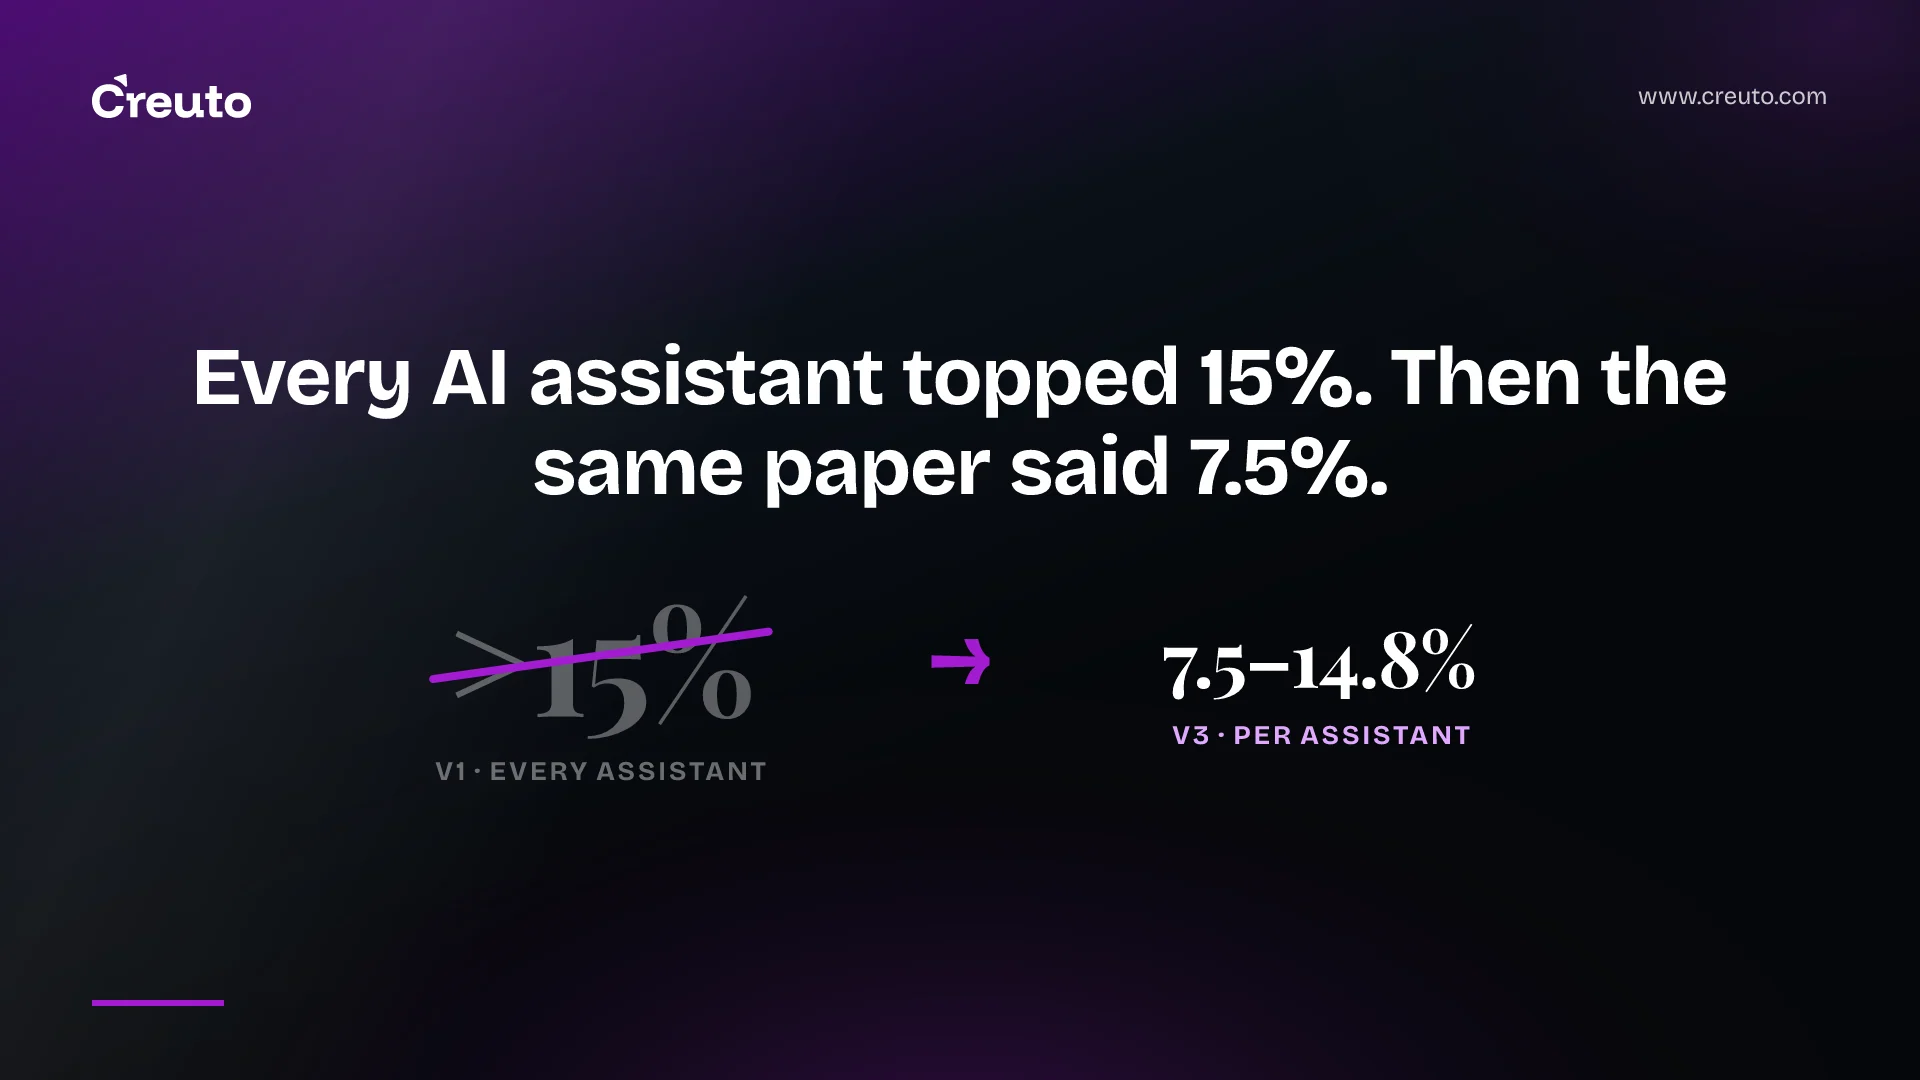
The most-cited study of AI generated code technical debt has revised its headline number. Version 3 of "Debt Behind the AI Boom", posted to arXiv on 13 October 2026, says 7.5% to 14.8% of each assistant's commits introduce at least one issue. Versions 1 and 2 said more than 15% of commits from every assistant did. The debt finding survives the revision. The scary number does not.
By the end of this post you will know what changed between the three versions, why the old per-tool figures could not add up, which findings still hold, and what the study cannot tell you. That matters if you are deciding how much review AI-written code needs before it merges, or quoting this paper in a slide.
What changed between v1, v2 and v3 of the study
The paper is by Yue Liu, Ratnadira Widyasari, Yanjie Zhao, Ivana Clairine Irsan, Junkai Chen and David Lo. It mines public GitHub history for commits that explicitly credit an AI coding assistant, runs static analysis before and after each commit, and counts the issues that appear on changed lines. Here is how the headline figures moved across versions, each taken from that version's own text.
| Figure | v1 (30 Mar 2026) | v2 (26 Apr 2026) | v3 (13 Oct 2026) |
|---|---|---|---|
| AI-authored commits | 304,362 | 302.6k | 302,579 |
| Repositories | 6,275 | 6,299 | 6,299 |
| Distinct issues | 484,606 | 484,366 | 484,366 |
| Code smells share | 89.1% | 89.3% | 89.3% |
| All commits with 1+ issue | 8.7% | 9.1% | 9.1% |
| Per-tool range | 17.3% (Copilot) to 28.7% (Gemini) | 17.4% (Copilot) to 29.1% (Gemini) | 7.5% (Copilot) to 14.8% (Gemini) |
| Issues surviving at HEAD | 24.2% | 22.7% | 22.7% |
| Analyzers | Pylint, Bandit, ESLint, njsscan | ESLint, Pylint, Semgrep | ESLint, Pylint, Semgrep |
Sources: v1 full text, v2 full text, v3 full text. If you have seen Copilot at 17.4% and Gemini at 29.1% quoted, those figures are real, but they are v2's per-tool range, not something the current paper says. Version 3 contains no note explaining the change, so treat any reason you read for it as a guess.
Why the old per-tool numbers could not add up
Versions 1 and 2 contradict themselves. Version 2 reports that 27,677 commits, 9.1% of 302,579, introduced at least one issue, while also saying more than 15% of every tool's commits did. Version 1 has the same gap: 8.7% overall against a per-tool floor of 17.3%.
Both cannot be true when each commit belongs to one assistant. In v3, the five tools' commit counts in Table 1 sum exactly to 302,579, and an average of rates that all exceed 15% cannot come out at 9.1%. The v3 per-tool range of 7.5% to 14.8% is at least compatible with the 9.1% overall figure. If you quoted "more than 15% for every assistant", the paper's own arithmetic no longer backs you.
Which AI coding assistant produces the most issues?
In v3, Gemini has the highest issue introduction rate and GitHub Copilot the lowest. Commit volumes differ enormously, so read the rates next to the sample sizes from the v3 paper.
| Assistant | AI commits | Repos | Commits with 1+ issue (v3) |
|---|---|---|---|
| GitHub Copilot | 118,012 | 4,487 | 7.5% |
| Devin | 14,302 | 298 | 9.4% |
| Cursor | 19,587 | 714 | 10.9% |
| Claude | 138,249 | 2,434 | 11.5% |
| Gemini | 12,429 | 681 | 14.8% |
The ranking changes with the metric. Claude has the highest average issues per commit, 1.95, and Devin the lowest at 0.89. The authors themselves warn that the differences "may be due to differences in usage patterns and development context, rather than the tools alone". A Copilot commit and a Devin commit are not the same unit of work, so this table is not a buyer's guide.
Where AI generated code technical debt still shows up in v3
The revision softened the frequency claim, not the debt claim. Of the 484,366 issues v3 attributes to AI commits, 89.3% are code smells, 6.0% correctness issues and 4.7% security issues. The most common smell is broad exception handling, at 41,374 instances; the most common correctness issue is an undefined variable or reference; the most common security finding is path traversal through path.join or path.resolve.
The more useful finding is net impact. On code smells, AI commits roughly break even: 432,748 introduced against 439,817 fixed. On correctness and security they do not. The paper says AI commits introduce more of both than they fix, and that "AI introduces about 1.5 times as many security issues as it fixes".
Then there is persistence. Of 464,900 tracked issues, 105,364 still survive at the latest revision, a 22.7% survival rate, and issues older than nine months survive at 22.8%. Version 1 broke survival down by type and found security issues survived at 41.1% against 22.7% for smells, but v3 does not report that split, so treat it as a v1 figure only.
What the study cannot tell you
The biggest limit is stated plainly in v3: "We also do not compare AI-authored commits against a baseline of purely human-written commits." Without that, 9.1% of commits introducing an issue is neither good nor bad. It is a number with no comparison.
- Scope: only production Python, JavaScript and TypeScript files in repositories with at least 100 GitHub stars; tests, docs, configs and vendored code are excluded.
- Attribution: AI authorship comes only from explicit Git traces such as bot logins, author emails, author names and Co-authored-by trailers. Unmarked AI code counts as human, and co-authored commits can mix human and AI edits.
- Tooling: static analysis produces false positives; the authors measured 85.9% precision for their issue pipeline on a validation sample. Architectural, design and test debt are out of scope.
- Survival: files deleted or rewritten before HEAD count as resolved, so the paper says survival may be underestimated.
How to control technical debt from AI coding tools
The paper's recommendations are modest: review AI-generated code "regardless of the tool used", keep static analysis, tests and security checks in the normal workflow, and extend review beyond the point of merge. Turning that into a pipeline looks like this.
- Run the study's analyzers on changed lines in CI. ESLint, Pylint and Semgrep are what v3 used. Fail the build on new correctness and security findings; report new smells without blocking, since AI commits already fix about as many smells as they add.
- Keep attribution in the commit. The study could only measure what Git trailers and bot logins recorded. If your team strips Co-authored-by lines, you lose the ability to compare AI and human commits in your own repo, which is the baseline the paper lacks.
- Track survival, not just introduction. A finding that is fixed within a sprint is cheap. Report how many flagged issues are still present at HEAD after 30 and 90 days.
- Weight review toward correctness and security. Those are the categories where AI commits run a deficit. Static analysis will not catch a wrong requirement, which is why an acceptance criteria review belongs in the same gate.
Tests need the same scepticism. AI-written tests can lift coverage without checking much, as we showed in our piece on AI generated unit tests and mutation testing. And task success on private code is lower than benchmarks suggest, per our look at AI coding agent success rate on real repositories. If you want these gates wired into an existing pipeline, that is the work of our QA and automation practice.
The decision this paper actually supports is not whether to allow AI assistants. It is whether your merge gate treats an AI commit's correctness and security findings as blocking, and whether you can see, three months later, which of them are still there.
Frequently asked questions
AI-generated code adds measurable technical debt in the largest study so far, which found 484,366 issues across 302,579 AI-authored commits and 22.7% still present at the latest revision. The study has no human baseline, so it cannot say whether AI code adds more debt than human-written code does.
In version 3 of the Debt Behind the AI Boom study, Gemini had the highest share of commits introducing an issue at 14.8% and GitHub Copilot the lowest at 7.5%. The authors say usage patterns and development context may explain the gaps, so the figures are not a tool ranking.
About 9.1% of AI-authored commits introduced at least one static analysis issue in the Debt Behind the AI Boom study, versions 2 and 3. Most of those issues were code smells; correctness issues were 6.0% and security issues 4.7% of the 484,366 issues found in version 3.
The Debt Behind the AI Boom study's version 3 cut the per-tool range from above 15% to 7.5%-14.8% without a note explaining why. Earlier versions also reported an overall rate of 9.1% or lower, which cannot coexist with every tool exceeding 15%, so the revision removed an internal contradiction.
Teams control technical debt from AI coding tools by running static analysis such as ESLint, Pylint and Semgrep on changed lines in CI, blocking new correctness and security findings, keeping Co-authored-by trailers for attribution, and tracking how many flagged issues still survive at HEAD months later.